


SBS
BaseStation
Tutorial Part 3.2
 |


BaseStation Display
Waypoint and Outline Data files
One of the most significant changes that can be made is to add extra detail to the radar display. This can be as simple as marking your house location or it can be the complexity of showing the whole UK airspace system.
There are two sets of files for data presentation:
|
Waypoint
files
|
Found in the Waypoint folder with a .WPT suffix These are simple text files that add a dot to the display with a name tag. Examples could be an airfield, a navaid or your favourite pub. |
|
Outline
files
|
Found in the Outlines folder with an .OUT suffix These are also plain text files but these create lines. Outlines are used to create line features like coastlines, controlled airspace, airfield layouts, roads, rivers or country boundaries. |
With both types of files the data you can add is unlimited (towns, motorways, lakes and football stadiums if you really wanted them) but beware that the more data you add the more the impact on loading and running the BaseStation software.
Format
for each type of file is slightly different.
Creating Waypoints
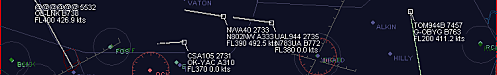
The screenshot below shows waypoints for airports in the USA. The waypoint appears as a dot with a name and (if required) a code.
A Waypoint file can contain one or many waypoints. For your house location it would be best to put this in one WPT file but if you are adding several points of similar type (like airfields or navaids) then it makes sense to put all these in a single file. For my UK minor airfields file a sample of the data is shown below:
Tatenhill,EGBM,7,2,52.8147,-1.761125,450
Ternhill,EGOE,7,2,52.87111111,-2.533333333,272
Thorne,EGCP,7,2,53.62222,-0.92806,0
Thruxton,EGHO,7,2,51.21043333,-1.599875,330
Tilstock,EGCT,7,2,52.93222,-2.64722,301
There are seven parameters for each data line. These are:
Name
, ID , Waypoint Field , Zoom
Level , Latitude , Longitude , Altitude
AMSL
|
Name
|
|
|
ID
|
|
|
Waypoint
Field
|
|
|
Zoom
Factor
|
|
|
Latitude
|
|
|
Longitude
|
|
|
Altitude
|
|
To use my first line above as an example:
Tatenhill,EGBM,7,2,52.8147,-1.761125,450
The airfield is called Tatenhill and
has an ICAO code of EGBM.
I have assigned it a Waypoint Field value of 7
and a zoom factor of 2 (it is a minor
airfield and I don't want it displaying permanently).
The airfield Latitude in degrees, minutes and seconds is N52:48:53. This
needed converting to decimal degrees of 52.8147.
Likewise the Longitude is W001:45:40. Being West it needs a negative value
to become -1.761125.
Airfield altitude is 450 ft AMSL.
There
are several Degree converters available online that will convert degrees,
minutes and seconds to decimal degrees.
Waypoint Fields
There are 30 Waypoint fields to use for differing waypoint groups. In the above example I have chosen Field 7 for my Minor Airfields listing and use this in other data sets in the UK and Ireland Airspace downloads. I use 16 of the 30 fields as shown below. Note that other providers of waypoint files may use different classifications.
If you create your own Waypoints you can choose any field you like for your data. You can select an existing category if you would like to use the same colour - or you can choose any empty field and set a colour you like for the waypoints. Using an empty field has the additional benefit of allowing you to turn the waypoints on and off independently to other fields.
To change the name in the Waypoint menu above to suit your new field data you can edit the BaseStation.ini file to add a new name. This is covered in the next tutorial section on tweaking the INI file.
Creating Outlines
Outlines are used to draw lines on the display. The screenshot below shows several different outline file to display coastline, airspace, VOR roses, and runway centrelines.
Outlines format is slightly different to that of waypoints. The example below shows the data for Danger Area EGD001 in the UK:
{Danger
Areas}
$TYPE=11
; EGD001
50.32167+-5.51167
50.40000+-5.65000
50.53333+-5.56667
50.65833+-5.40000
50.71667+-5.20833
50.64167+-5.07500
50.32167+-5.51167
-1
The first line in curly brackets describes the outline data - any text can be put here.
The second line sets the Outline Field or layer - in this case it shows Outline Type11 which I use for Danger Areas in my UK set.
Comment lines can be added if you use a semi colon as I have used in the third line. In this case it reminds me that the subsequent data is for Danger Area EGD001 - important because the file contains the information for all the UK danger areas.
After that there is a succession of Latitude and Longitude values to plot the lines being drawn. As with Waypoints the values are in Degrees and decimal degrees with positive values for North and Eastern hemispheres and negative values for Southern and Western hemispheres. A plus sign must be inserted between the Lat and Long values. In the example above you will see plus and minus signs - this being because the Longitudes are westerly and are negative values.
The final -1 is to stop the lines being drawn (basically a pen up command before moving on to the next point). This allows you to draw several objects in the same file.
Outline Fields
There are 30 Outline fields to use for differing outline groups. In the above example I have chosen Field 11 for my Danger Area outlines and use this in other data sets in the UK and Ireland Airspace downloads. I have used 22 of the 30 outline fields for differing outline types as shown below. Field 14 and 16 are unused and the fields from 26 to 29 are used for the SBSPlotter program. Note that other providers of outline files may use different classifications for their work.
If you create your own Outlines you can choose any field you like for your data. You can select an existing category if you would like to use the same colour - or you can choose any empty field and set any colour you like for the outlines. Using an empty field has the additional benefit of allowing you to turn the outlines on and off independently to other fields.
To change the name in the Outline menu above to suit your new field data you can edit the BaseStation.ini file to add a new name. This is covered in the next tutorial section on tweaking the INI file.
Checking your data
If you create your own outline or waypoint files it is important to check that these load correctly. It is easy to make an error when adding data and if a file fails it stops the loading process. This means that any subsequent outline files will also not load - usually a good indication that something has gone wrong.
You can check if a file has failed by using the Debug tools in BaseStation. If you scroll down the debug list the screen will identify which OUT or WPT file has failed. In the example below I deliberately created a failure point in the UK04_NDB's.wpt file to trigger an error. Note that this didn't stop further files from loading but this isn't usually the case.
See Section 3.4 for more information on Debug.
Importing data
Creating waypoint and outline files is time consuming and errors in any large file are hard to track down. For some users it would be preferable to download existing sets of data and several are now available.
UK data - A full set of UK waypoints and outlines are available from my Kinetic Utilities page. The data covers all the airspace and waypoint information available for the UK. Although you can install and display the lot it is better to pick the files you think suit your display best. Here is a sample:
World-wide data - For this data we are indebted to Andy (threemiles) at JetVision. Unlike the UK data Andy has created file sets that are centred on a 200nm radius of selected airports around the world. For further details go to http://jetvision.de/sbs/