


SBS BaseStation
Tutorial Part 3.1
 |


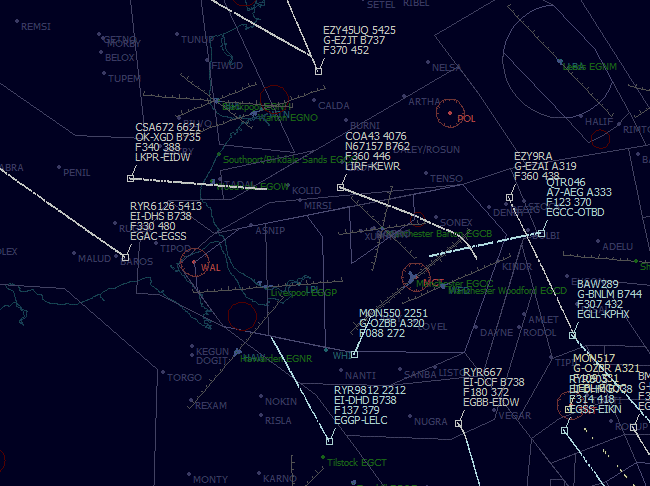
BaseStation Display
Adjusting BaseStation Settings
The screenshots used on these pages are from a PC running Vista and BaseStation 1.1.1.130. Users on XP or earlier BaseStation versions may have slightly different displays.
Menu Options
The menus in the BaseStation software are described in detail in the supplied help file. There are seven menus -
File , Edit , Radar , Aircraft , MapModeS , Settings , Help
Most are straightforward but I recommend reading the sections on Radar and Aircraft as there are some very useful options in both which may not be obvious at first glance.
In truth many users may find the menu system a bit daunting after initially setting up BaseStation and I recommend you settle down with the system for a week or two. When happy with how the software works you can then start looking more closely at the Radar and Aircraft menus and play with the values.
Settings
The Settings menu is a different matter. This is extremely versatile and it allows users the ability to adjust the default settings considerably. The complexity of this menu may be daunting so I hope this tutorial may provide a little more insight into how users may get the best of the Settings functions.
The BaseStation Settings menu is sub divided into 10 sections and I shall describe these in sequence.
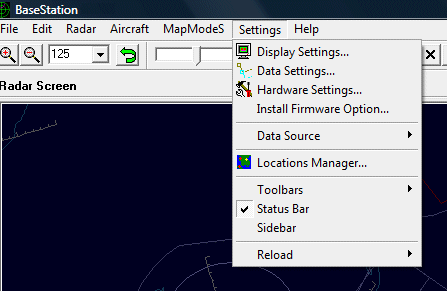
Sections:
| Display Settings |
| Data Settings |
| Hardware Settings |
| Install Firmware Option |
| Data Source |
| Locations Manager |
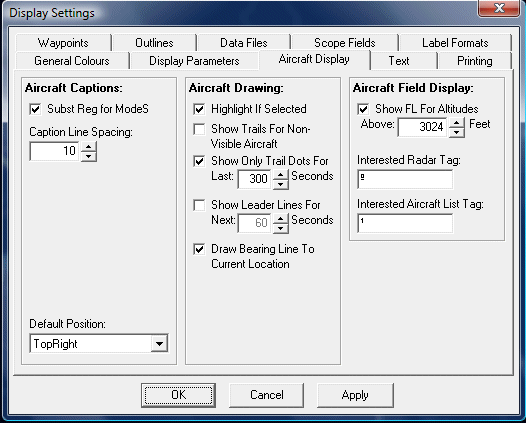
Clicking on the Display Settings option will bring up the following window.
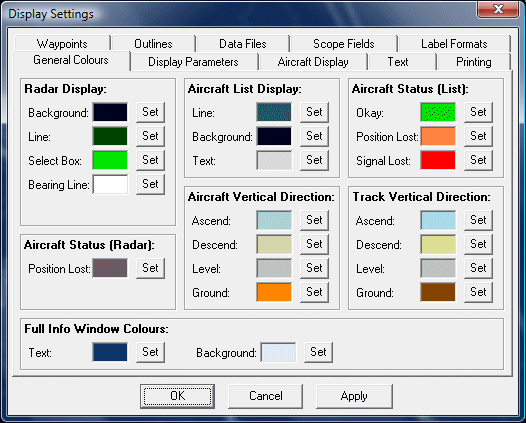
There are ten tabs in the Display Settings menu -
General Colours, Display Parameters, Aircraft Display, Text, Printing, Waypoints, Outlines, Data Files, Scope Fields and Label Formats.
There are a lot of options to cover here and I'll go through each tab in turn.
General Colours
The SBS display can be adjusted to an infinite level when it comes to screen colours. Some users may like the default green display as shown at the top of the Intro page, some may prefer a display that looks similar to a real radar (dark background with light aircraft data tags - also shown on the Intro page). Some users prefer a high key display using a very light background and dark aircraft data - this variation reported to be much better on laptops when used outdoors.
Every parameter on the display can be changed - background, trails, aircraft, outlines and waypoints. Below is the General tab and this shows the current colour set I am using.
To change the colour for any option just click on the SET box and either choose from the fixed Windows colours or select a colour from the right hand palette and click on the Custom Colour button. Make sure the colours you choose are quite different to that selected for the radar background otherwise you can easily make items disappear into the background.
Radar Display
Background - sets the background colour of the radar display. Choose this value carefully as you are laying up to nine other colours on top of the display which all must remain prominent.
Line - sets the colour of the range rings.
Select box - sets the colour of the aircraft target box. Note that the Highlight if Selected option in the AircraftDisplay tab also need to be set on for the aircraft dot to highlight.
Bearing line - sets the colour of the range and bearing line to an aircraft.
Aircraft Status (Radar)
Sets the colour of the aircraft data tag after its position has been lost. Once lost the aircraft remains fixed on screen until the timeout period is over so it is a good idea to make this colour obvious so that you know you are looking at a stationary target.
Aircraft List Display
These options set the background, line and text colours for the Aircraft List display independently of the radar screen display.
Aircraft Status (List)
This option sets the colours for the Status symbol in the Aircraft List. The symbols are a circle, four dots or an aircraft depending on the data being sent. The colours change as the aircraft is lost or removed from the radar display.
Aircraft Vertical Direction
These options set the colours for the aircraft data tag only and can show if it is climbing, descending, level or on the ground.
Track Vertical Direction
This option sets the colour of the aircraft's trail - this is independent to the data tag. I use similar colours to the data tag.
Using the above settings my radar screen looks like this:
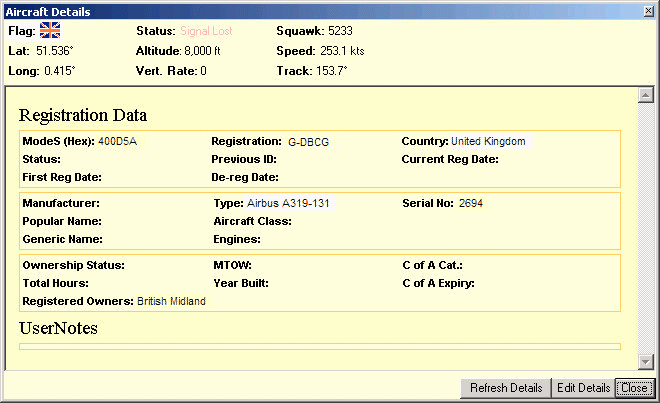
Full Info window colours
This option sets the text and background colours for the Aircraft Details window. Note that only the text and colour in the centre of the window changes (the Registration Data area) - you cannot alter the top nine lines of data or its pale yellow background.
Display Parameters
This window is becoming more detailed with each release of BaseStation as new options are added.
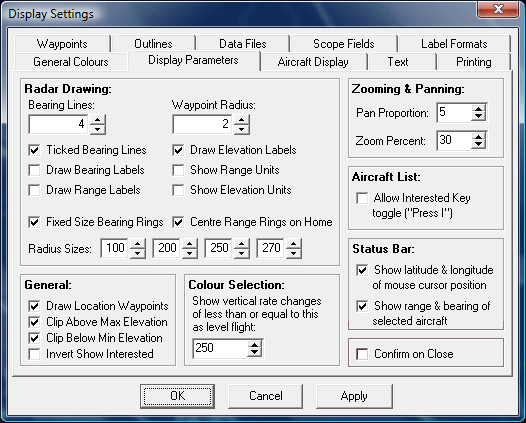
Radar Drawing
This section mostly deals with the range ring settings - but with one exception.
Waypoint radius - sets the size of the dot for each waypoint. As the screen is a vector plot the dot does not increase in size as you zoom in or out. The default size is one but I prefer a value of 2 to make the dot a little more visible at high zoom settings.
Range Rings
Before we start talking about the values in this menu it is worth mentioning that the range rings have two components - the radius rings and the bearing lines. The rings and "spokes" are controlled by different menu items.
Bearing lines - sets the number of spokes on the display. A value of 12 will set bearing lines at 30 degree intervals and a value of 4 will just set North, South, East and West lines.
Ticked Bearing Lines - turns on or off the spokes. If unticked only a small spike will appear at the outer range ring to mark the bearing.
Draw Bearing labels - displays the compass degrees on the outer ring of the display.
Draw Range labels - displays the distance of each range ring. This is shown along the north axis of the display.
Draw Elevation labels - set the height values on the Elevation profile on the radar display (if enabled).
Draw Range units - adds the unit value to the range value. It will therefore show 85nm instead of 85.
Draw Elevation units - likewise adds the unit value to the height figure to give 25000ft rather than just 25000.
Fixed Size bearing rings - allows you to choose between range rings that are uniformly spaced and always fit the radar screen (which means the ranges will vary with zoom factor) or you can specify four fixed range values in the boxes beneath.
Centre Range rings on Home - Locks the range rings to your home position. If not selected range rings always display from the centre of the display.
General
Draw Location waypoints - this will display all locations that have been set up in the Location Manager. Note that Field 15 in the Waypoints menu also needs to be turned on for these to show.
Clip Above Max Elevation and Clip Below Min Elevation. These are related to the option in the Radar menu called Set Elevation Upper and Lower Limits. You need to have applied a height filter for the clipping to work. Note that height filters are specific to the radar tab selected - they are not generic to all tabs.
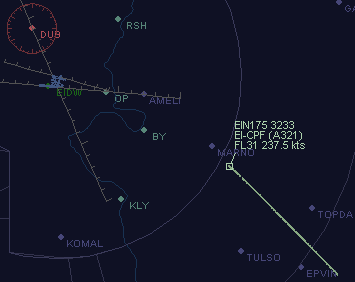
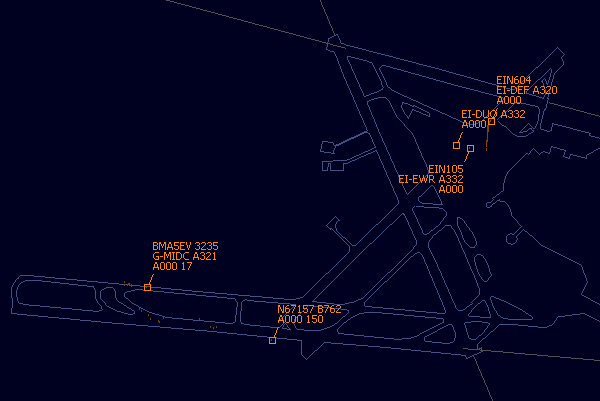
If you enter values for upper and lower height bands - let's use 15000ft and 0ft - in the Set Elevation Upper and Lower Limits menu the limits will only restrict the height band for the Elevation screen of the radar display. In the example below the aircraft at FL169 does not show on the Elevation display but it still appears on the main radar screen.
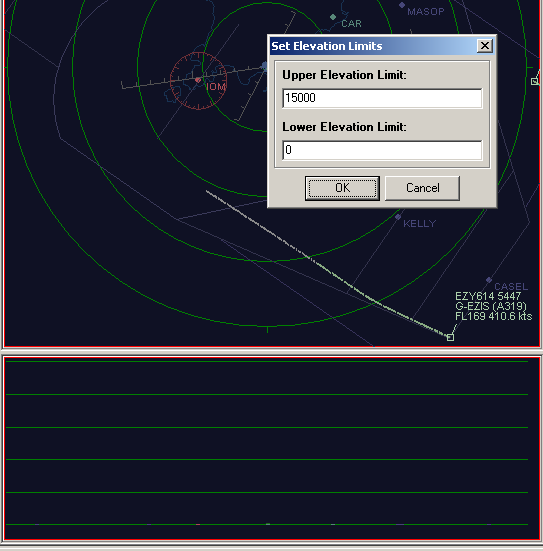
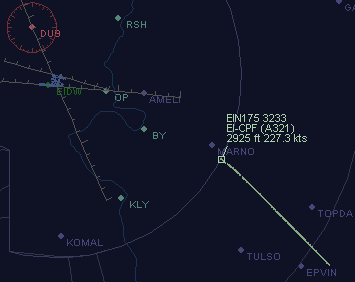
If you enable the two Clip options the height restrictions will be applied to the main radar screen too.
 |
Clip options OFF
|
 |
Clip
options ON
|
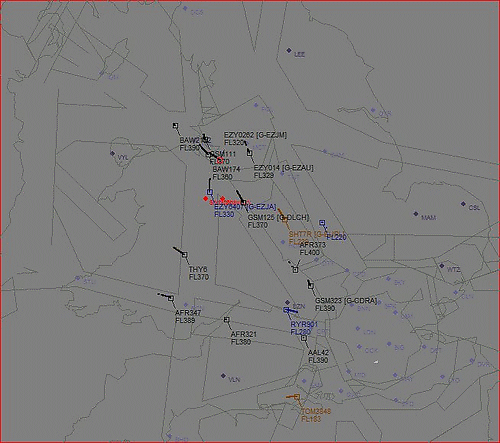
Notice in the second screenshot that the RYR294, RYR105S and EZY6726 aircraft are outside the filter limits and are no longer on the display. Note that for RYR294 its trail still exists up to the point it climbed through the cut-off level.
Warning 1 - Clip options and height filtering are not readily apparent! You must remember if you have enabled them and that you may not be seeing all the traffic.
Warning 2 - Height filtering is saved when you save a view! Check your radar tabs one at a time to see if any height limits have been accidentally applied. See Radar Views
Colour Selection - Aircraft that are not quite maintaining level flight may constantly show climbing or descending colours on the display. This option allows you to set a vertical rate value below which these will be ignored.
Zooming and Panning - is fairly obvious and sets the rate at which the screen can be zoomed or panned using either the menu buttons or the mouse scroll wheel.
Aircraft List - a recent addition for users to set/unset an aircraft as Interested. If you set this option then it allows you to select an aircraft on your screen and by pressing the "I" key the aircraft will be set with the Interested flag. This is very useful if you see an aircraft you wish to keep a note of. Pressing "I" again will disable the Interested tag.
Status Bar - a recent and neat addition which allows the mouse cursor to show Lat and Long on the status bar. The range and bearing can also be viewed on the status bar as an alternative to this showing on the radar screen.
Confirm on Close - this option results in the "Are you Sure" popup window appearing when you close down BaseStation - enabled as default on earlier versions. Removing the tick will result in BaseStation closing instantly when you press the Close button.
Aircraft Display
Again most of these are covered by the documentation but a few explanations may be worth adding.
Aircraft Captions
Sub Reg for Mode S - Changes the Mode S code on screen to the aircraft Registration. Although there is now a separate Registration field in the aircraft data tag this option can be handy to use instead. If a registration is known this will display on radar but if an unknown aircraft appears the Mode S code will display instead - whereas the Registration field would leave an empty display.
Caption line spacing - reducing spacing between the lines keeps the data tags neat. The setting should be matched to font size otherwise you can get overlapping data tag lines. I use 10 to complement the aircraft tag settings of Tahoma 13pt font.
Default Position - This specifies the position of the aircraft's data tag relative to the target. By default the data tag will appear to the top right of the aircraft. This option sets the position for all data tags but you can change an individual data tag by selecting the aircraft and using F11 or F12 to rotate the tag position.
Aircraft Drawing
Highlight if Selected - Changes the colour of the aircraft target when clicked on. The colour changes to the Select Box colour defined in the General Colours tab.
Show Trails for non Visible Aircraft - If an aircraft disappears off the edge of the screen the trail will automatically disappear. This can be disconcerting - especially if you have long trails set. Ticking this option leaves trails to decay over the time period specified.
Show Only Trail Dots for Last xxx Seconds - This option allows you to turn on or off aircraft trails and to set the time period they will display. I leave mine set to 5 minutes most of the time as setting long time periods has a marked impact on system load.
Note: Trails are kept in memory so you can default to a short time period for general use. If you want more trail history you can increase the timeout value - this will immediately increase trail length for all aircraft on screen..
Show Leader Lines for next xxx seconds - I recommend you leave this option turned off. Although it will give a leader line showing the projected path of the aircraft over the time specified the result is rather erratic.
Draw Bearing Line to current Location - Makes the bearing line centre on the Location selected in Location Manager. If turned off the bearing line defaults to the centre of the screen.
Aircraft Field Display
Show FL for Altitudes above xxx - Aircraft altimeters are set to QNH (height above sea level) near airfields but are changed to a Standard Pressure Setting of 1013.2mb for en route flight. This ensures pilots do not have to keep changing altimeter settings as they fly into regions of high or low pressure. If 1013.2 is set pilots report height as Flight Level but if QNH is set pilots report height as Altitude. The point at which an altimeter is reset is called the Transition Altitude.
A problem here is that Transition Altitude varies. In the USA the TA is set at 18,000ft but each country has it's own values (it is basically relative to the the highest ground in a region). For the UK it is slightly more complex with a generic Transition Altitude of 3000ft across the country but certain TMA's have set higher values - London TMA for example uses a TA of 6000ft.
If you know the Transition Altitude for your local airport you can enter the height in the Alt box and tick the Show FL for Alt. The screen will then show Flight Levels above this height and Altitudes below - as seen below. Perfectionists will spot the error in that the Dublin Transition Altitude is not 3000ft - I forgot to reset the SBS setting to 5000ft.
Interested Radar Tag - Allows you to specify a single character or symbol to display on the Data Tag for aircraft marked as Interested.
Interested Aircraft List Tag - Similarly this allows you to specify a character or symbol to display in the Interested column of the Aircraft List for aircraft marked as Interested.
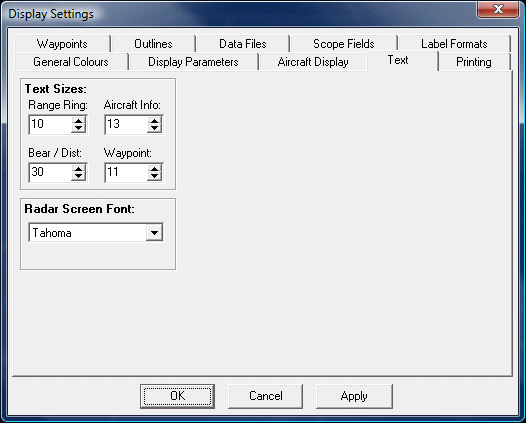
Text
If your screen display seems cluttered you can reduce this by altering the display font and font size.
In the screenshots below I have used 13pt Tahoma for Aircraft data tags but this may not suit all users. Experiment freely with these settings to find a font and size that you find easy to read but does not swamp your screen excessively.
Note that I have set Bearing and Distance to quite a large size because this information can get buried behind aircraft data tags. In practise I rarely have this function active as the data is now provided on the status bar.
Waypoints
There are 30 separate Waypoint layers or fields, each having its own colour option. I have adopted the fields below for my UK airspace data files:
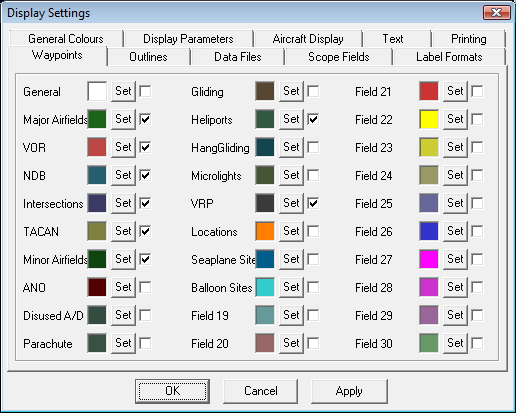
As you can see above I have used 15 of the 30 fields for my different waypoint types - which leaves 15 free for users to add further waypoint field types if needed. Users can also use the existing fields for their own data files if the title is appropriate for their information. See the next tutorial section for details on adding your own waypoint data.
Changing the colour of each field will alter the colour for every waypoint using that field type - obviously really but it can be overlooked when tweaking.
The check box to the right of each section will enable or disable that section in the BaseStation software. This is very useful as a quick method of reducing screen clutter if all sections are flagged as active. As well as having control over each waypoint field users can turn off all waypoints by using the icon on the main BaseStation display. A third level of control is also available whereby individual data files can be turned off - this is covered below.
Outlines
As with Waypoints there are 30 layers or fields for Outlines - 25 of which have been used for the UK data set.
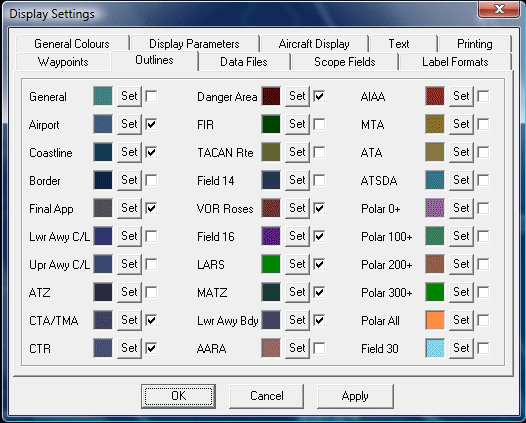
As with Waypoints the colours can be altered for each of the fields and the check boxes can be used to quickly turn on or off each individual field type. As seen in the example above I have only activated 11 of the 25 fields on my display for the session.
Data Files
The Data Files section shows you a full list of all Outline and Waypoint files that are loaded when BaseStation starts. In effect it should be identical to all the files that you have in your Outlines and Waypoints folders.
The files that are ticked are those that display in BaseStation. If you untick any box the file is still loaded in memory but it does not display on screen.
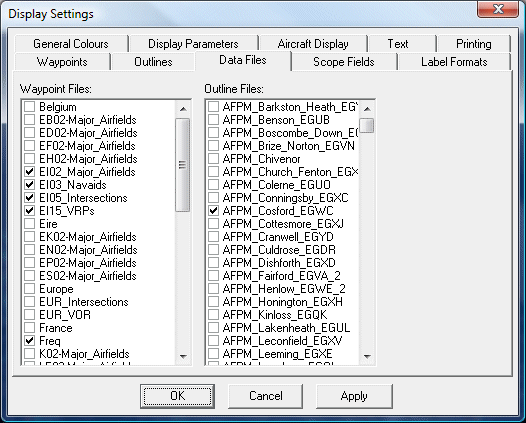
Note that if the BaseStation seems to be taking a long time to load you may have too many waypoint or outline files in your BaseStation folders. You will not get any improvement just by turning these files off in the menu above as this will only stop those files from displaying, not from loading. If you need to reduce loading time or memory load the best option is to move unnecessary files out of the Outline or Waypoint folders and into a storage folder so they don't load next time you start BaseStation.
In the example above I have waypoint files for the major airfields of most European countries listed (and therefore loaded) in BaseStation. This isn't sensible as my aircraft detection range goes nowhere near the continent and it would be more prudent to move these files to a storage folder.
In the Outline Files section things are worse as I have a lot of airfield plans listed. Even though Cosford is the only file set to display on screen the remaining airfields have all loaded into memory on startup - and as these files are big it's a lot of memory. Again l should really move the unneeded files to a spare folder. I could easily delete these files but if moved to a spare folder they are always ready to be copied back into the Outlines folder should I ever need them.
The efficient management of your outline and waypoint files is worth the time and effort.
Scope Fields
This menu allows you to choose the content of the aircraft's data tag on the radar display.
There
are 18 values that can be displayed in the data tag:
|
4
|
Callsign |
|
5
|
Squawk |
|
1
|
Registration |
|
3
|
ICAO Type |
|
8
|
Altitude |
|
7
|
Speed |
|
11
|
Popular Name (Route data) |
|
6
|
Track |
|
9
|
Vertical Rate |
|
15
|
Owner |
|
10
|
Manufacturer (Sub Operator) |
|
0
|
Mode S |
|
13
|
Generic Name (Radio Callsign) |
|
12
|
Type |
|
2
|
Serial |
|
14
|
Year Built |
|
16
|
User Tag |
|
17
|
Interested |
In the list above blue fields show data coming direct from your SBS and pink fields show data taken from your database - assuming you have populated these manually or with SBSPop/Active Display.
Some
of these fields may seem odd (like YearBuilt) but some dormant fields
have been adopted by third party software for other uses. For example:
GenericName - Radio Callsign (e.g. shows Speedbird
4567 for BAW4567)
PopularName - Route
Manufacturer - Sub Operator
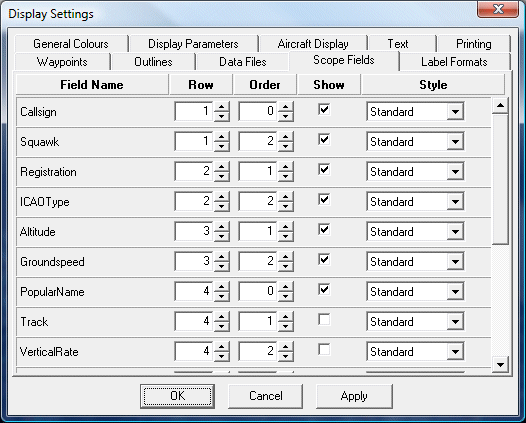
In the example above my data tag has seven values active set in four rows (max available is five rows):
Callsign and Squawk on the top line (1,0 and 1,2), Note
these could be 1,0 and 1,1 or even 1,1 and 1,8 - it's not critical.
Registration and ICAO Type on the second line (2,1 and 2,2),
Altitude and Groundspeed on the third line (3,1 and 3,2),
PopularName on the fourth line (4,0). PopularName is used by some
applications to hold Route data.
The result is a data tag that looks like this:
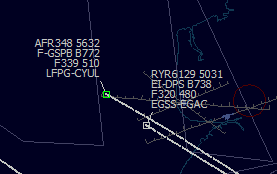
Many variations are possible:
 |
Callsign
- Squawk Reg - ICAO Type Height-Speed Owner GenericName (Radio Callsign) |
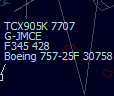 |
Callsign
- Squawk Registration Height-Speed Type - Serial No. |
The Style option allows each field to be displayed in differing formats. Choices are Standard, Round Brackets, Square Brackets, Pre-Dash, Post-Dash, Pre-Bar and Post-Bar.
Care is needed as a proliferation of data on each data tag can all too rapidly lead to garbling - a condition where adjacent data tags overlap to make the information unreadable.
Label Formats
This menu allows you to set the format of the Track, Speed, Vertical Rate, Altitude and Flight Level values for the aircraft's data tag on the radar display.
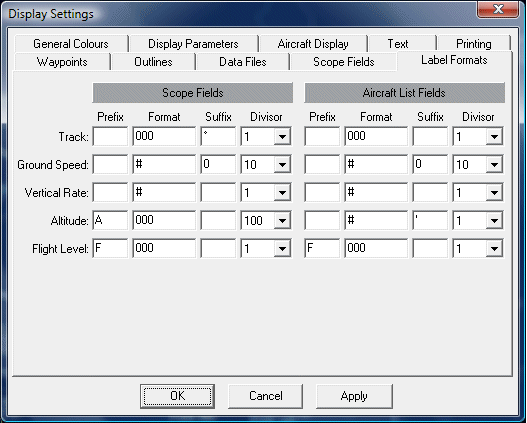
This menu is slightly tricky to get to know but it can produce good results. It allows you to alter the format of each data field and also to add any text as a prefix or suffix to the value. To illustrate this let us look at the Track field. A good prefix could be the text TRK or Track - but we could also just use a suffix of Deg or a degree symbol..
|
Prefix
|
Format
|
Suffix
|
Display
Result for
an actual Track of: |
|
|
245.3347
|
006.511877
|
|||
|
Trk
|
#
|
Trk
245
|
Trk
6
|
|
|
#
|
Deg
|
245
Deg
|
6
Deg
|
|
|
#
|
°
|
245°
|
6°
|
|
|
000.00
|
°
|
245.33°
|
006.51°
|
|
|
Track
|
000
|
°
|
Track
245°
|
Track
006°
|
|
00
|
°
|
245°
|
06°
|
|
|
°
|
245.3347°
|
006.511877°
|
||
The Prefix and Suffix options are reasonably obvious but the Format options require some explanation.
Track - The # symbol will give an Integer value for the field. This is very useful because if the Format field is left blank it will return the full value of the Track as recorded by SBS - this will show on screen to 12 decimal places - 245.565444351257!
If we use zeros instead these are similar to Excel formatting. A single 0 in the format field isn't good for a track value because 245 will show as 245 but a track of 006 will only show as 6. It is therefore sensible to use 000 so that we get a value of 006 displaying - the normal convention for displaying a heading. Users could also try 000.00 to give a heading display of 006.35 is so wished.
Vertical Rate - For Vertical Rate I use # because it has a further advantage. If the value of the field is zero (no rate of climb) then using # will leave an empty value rather than 0. With the majority of aircraft being in the cruise it would be pointless them all showing a zero value (screen clutter) - having nothing displaying is the better option.
Groundspeed - Most users may be happy to use # in this field with a suffix of kts. This will display a speed of 437kts. For my display I have taken this a step further and have altered the settings so that they round speed up to the nearest 10kts rather than give exact values. The above screenshot shows the settings to do this.
Height is split into Altitude and Flight Level but Flight Level is only active if you enable the Flight Level option in the Aircraft Display tab.
Altitude - Most users will be happy with using # here - maybe with a suffix of ft. This would yield a value like 1500ft. As the # option returns no screen value if zero it means that the Aircraft List field will be blank for aircraft on the ground (these automatically default to 0 altitude) and therefore a 0 may be preferred - this would show as 0ft.
|
Height
(ft)
|
#
and '
|
0
and ft
|
A
and 000
|
|
39,000
|
39000'
|
39000ft
|
A390
|
|
25,000
|
25000'
|
25000ft
|
A250
|
|
10,000
|
10000'
|
10000ft
|
A100
|
|
5000
|
5000'
|
5000ft
|
A050
|
|
1000
|
1000'
|
1000ft
|
A010
|
|
500
|
500'
|
500ft
|
A005
|
|
0
|
'
|
0ft
|
A000
|
On
my radar display I use an ATC convention for height values. The settings
shown in the screenshot produce values like A015
for 1500ft and A007 for 700ft. For
the Aircraft List I use normal height readout.
Flight Level - Users may prefer using a prefix of FL rather than my illustrated F. I've not chosen # for this field but have elected for 000 instead. The difference is only really noticed below 10,000ft when you will see the following:
|
Height
(ft)
|
F
and 000
|
FL
and #
|
|
39,000
|
F390
|
FL390
|
|
25,000
|
F250
|
FL250
|
|
10,000
|
F100
|
FL100
|
|
5000
|
F050
|
FL50
|
|
3000
|
F030
|
FL30
|
The difference is minor but it illustrates the subtle changes that can be used in display formats.
Clicking on Data Settings will bring up the following window:
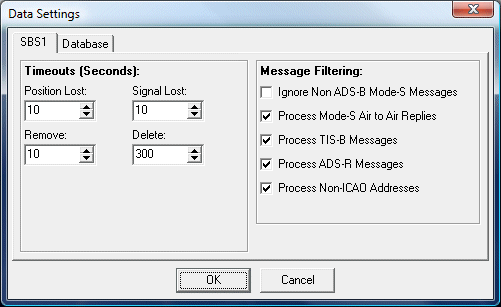
SBS
Timeouts
The Timeouts determine what happens after an aircraft's signal is lost. These are subtle and you have to know what the four options mean to get the values set up as you would ideally like. Higher values retain more data but may have an impact on your system.
When an aircraft passes out of your SBS coverage the aircraft's data is lost. Initially the aircraft target will freeze in the last detected position on the radar screen. If no further signal is received from the aircraft the displays will trigger as follows - assuming default colours have been left unchanged:
|
Position
Lost
|
AFTER
the Position Lost time-out value expires:
|
|
|
Aircraft
List
|
The
aircraft status icon will turn YELLOW
|
|
|
Radar
Display
|
The
aircraft's data tag will also turn YELLOW
(unless you have changed this for another colour). |
|
|
Signal
Lost
|
AFTER
the Signal Lost time-out value expires:
|
|
|
Aircraft
List
|
The
aircraft status icon will turn RED
|
|
|
Radar
Display
|
The
aircraft will disappear
|
|
|
Remove
|
AFTER
the Remove time-out value expires:
|
|
|
Aircraft
List
|
The
aircraft will disappear
|
|
|
Delete
|
After
the Delete time-out value expires the aircraft will be purged from
memory.
|
|
Using my values above of 10, 10, 10 and 300 you should see the following happen once the aircraft's signal is lost:
|
1
|
0
sec
|
When aircraft's signal is lost the aircraft tag will freeze on the radar screen. |
|
2
|
After
10 sec
|
The
data tag will remain frozen during this time and will turn yellow
The Aircraft List's Status icon will turn yellow |
|
3
|
After
20 sec
|
The
data tag will be removed on the radar screen. The aircraft will still appear in the List but the Status icon will turn red |
|
4
|
After
30 sec
|
The aircraft will be removed from the Aircraft List. |
|
5
|
After
330 sec
|
The aircraft data is written to the SQB file and purged from memory. |
I would suggest that the values for Position and Signal Lost do not exceed 120 seconds added together. On a busy approach long timeouts will see the aircraft frozen on screen and the following aircraft may appear to run into the stationary aircraft. Setting Position Lost to too short a time is equally not a good idea as it may result in aircraft constantly changing colour if they are flying in areas of intermittent contact.
The Remove value can be as long as you wish if you like aircraft to remain in the Aircraft List after they have disappeared on radar.
Note that some users set Delete values extremely high - usually to 86400. This was to ensure no data was lost in the old (Spider) software version and a full 24 hour log could be retrieved. With the present software there is no need for such long timeouts as the data is written to the database and can be retrieved in Reporter. Note that delaying the Delete value excessively delays the endtime and positional data from being written to the SQB file.
Warning - if you reduce the Delete time-out value to a lower figure BaseStation will freeze for a minute or so. This is because the data in memory is being purged.
Message Filtering
There are now five filtering options - four of these being specific to DF16 and DF18 data now being decoded by the SBS unit.
Ignore Non ADS-B ModeS Messages - if you tick this box then your data will be limited to ADSB aircraft only - you will lose all Mode S only data. The most obvious effect is that your Aircraft List will no longer show any Mode S (those showing four dots) aircraft. Best left unticked.
Process Mode S Air to Air Replies - BaseStation now decodes DF16 TCAS signals sent from aircraft to aircraft. This is useful in some countries with poor or no Mode S ground radar coverage because without these aircraft will not send some data - particularly height and squawk. If you already receive good height/squawk data it is best to turn this option off as the volume of these signals is immense.
Process TIS-B messages - TIS-B is the broadcast of traffic information to ADS-B-equipped aircraft from ground based stations. TIS-B is a USA concept which is part of their UAT system broadcasting on 978MHz for GA. This technology is currently specific to the USA and unlikely to be used in Europe.
Process ADS-R messages - Automatic Dependant Surveillance-Rebroadcast message. Automatic Dependant Surveillance-Rebroadcast accommodates the dual link nature of ADS-B, which broadcasts on both 1090 MHz-for air transport, military and high-end general aviation aircraft-and the Universal Access Transceiver (UAT) on 978MHz - for lower cost airborne avionics on aircraft flying below 24,000 feet. ADS-R will translate all 1090 MHz messages and re-transmit them in UAT format, and vice versa. Therefore, ADS-R assures that UAT and 1090 MHz aircraft will see each other.
Process
Non ICAO Addresses - DF18 signals do not have to use the unique ICAO
allocated 24 bit address system nor need they be unique. Such messages
cannot be decoded by BaseStation to a specific country. These addresses
are most often seen in the USA but are sometimes used by transponders
in ground vehicles worldwide.
Database
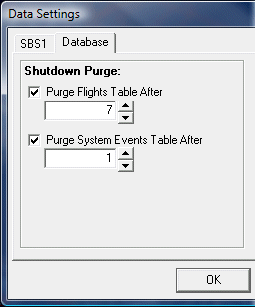
Depending on how often you run your BaseStation software the SQB database can grow to considerable size. In addition to the aircraft records the database also contains records of all flights operated during each session and these mount up rapidly. 270,000 flight records in a three month period is quite feasible - roughly 23,000 flights per week.
Flight records (the data shown in the Sessions tab in Reporter) can be limited by using the Purge option in the BaseStation software.
Be careful when you use this option to reduce the value. If you change from 30 days to 7 days the flight records will be permanently lost as soon as you hit OK - you can't get them back for the 23 days you have just erased. Purging this data does not remove any aircraft records - you can never lose these.
I don't require historical data so my limit of 7 days is quite low. Other users may prefer to set 31 days to keep a month's data or even 365 days for a year. There is no problem with this if you accept that the database will be huge - the only limitation is the size of your hard drive.
An alternative option is to set a low value like 31 days but every 30 days (don't leave it for 31 days or you will lose a day's data) you open Reporter and use the Export Flights menu to save all your historical data as a CSV file. This keeps the SQL database nice and small but your records are archived in the CSV files. My thanks to SabreJV for this tip.
The System Events record the start up procedure for BaseStation. If this is working OK there is no real need to keep records for an extended period. I use a 1 day purge setting.
Clicking on the Hardware Settings option will bring up the following window. It has tabs for Network, Radio and GPS.
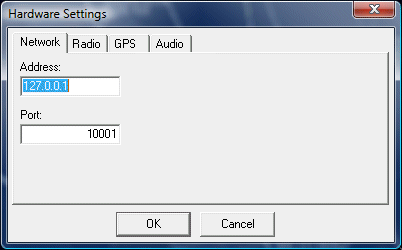
Network
The
Network tab is only required by users who connect their SBS to their PC
via the Ethernet interface. The IP Address of the SBS should be entered
in the Address window and the port in the Port window. Note that the Ethernet
connection is a two stage process - see the Data Source option below.
Radio
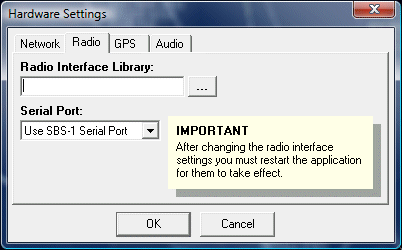
If you have an active Radio Scanner Interface licence (see below) the library option allows you to select the correct interface file for your scanner.
You may also elect to have the scanner connected to your PC's serial port or the serial port on the SBS1.
GPS
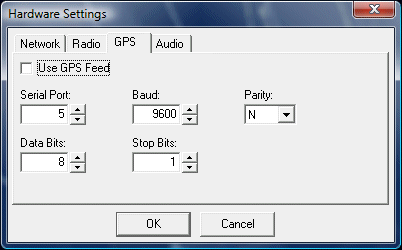
This is a very useful feature if users are mobile and they have GPS data available on their PC or laptop.
In normal use BaseStation requires a home location set up in the Locations Manager (see below). If you move around the country a lot you have to add further locations so that BaseStation knows your current position. This is very essential if you are likely to pick up ground traffic because if position is incorrectly set the ground targets may not show on the radar screen in the correct position.
With the GPS option your location is determined from the GPS signal and the Location Manager data is ignored. The GPS unit must be able to send data in NMEA format otherwise the data stream will not be recognised.
The settings may be critical for some units so check your GPS handbook for correct Baud, Parity and Data Bit rates. You may also need to check the Serial Port the GPS is using - you should find this in Window's Control Panel in the Ports section.
Do not activate the GPS option if you have no GPS device connected - it can lock up BaseStation!
With the GPS connected to the PC the Use GPS Feed option can be enabled. If successful you should see a GPS Up icon appear in the BaseStation status bar.
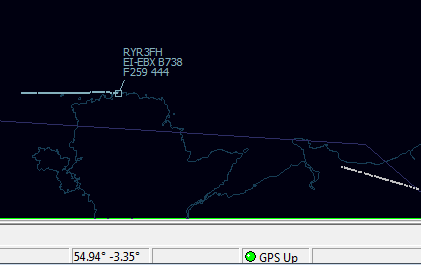
The next step is to check that GPS data is being received. The GPS connection should bring up a new menu item in the Settings menu called GPS Status and selecting this should open a window with GPS connection details.
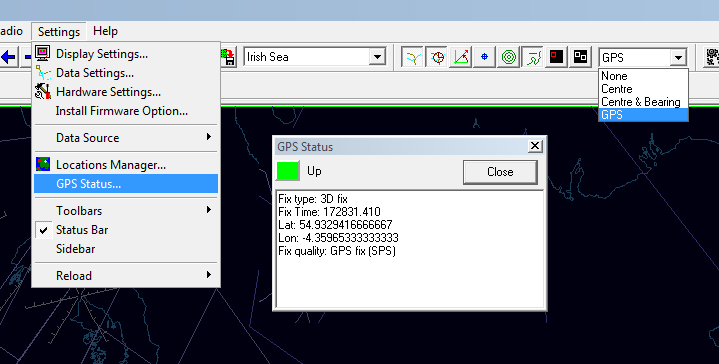
If the window shows good data you can now use the drop down menu to switch to GPS (see above right) at which point your radar screen should now lock to the GPS position.
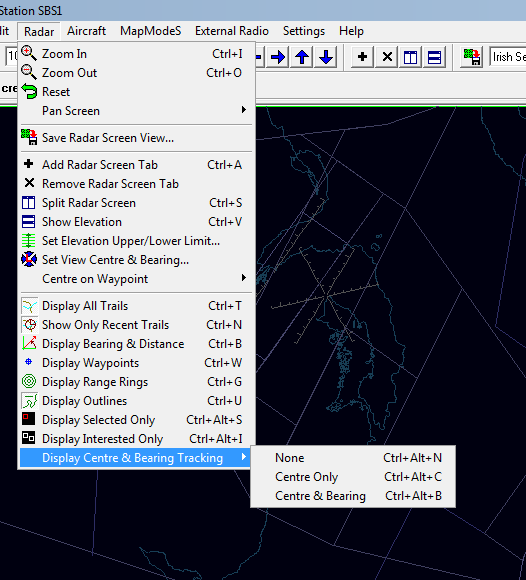
Note that although Centre and Bearing choices are also available from the Radar menu the GPS option is missing in this list.
Audio
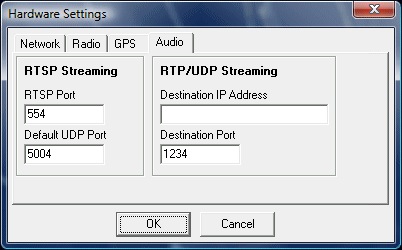
BaseStation provides audio streaming via RTSP and RTP/UDP. Your media player must support 16-bit linear PCM delivered over RTP/UDP (VLC and Apple QuickTime are examples).
The tab above is for advanced users and allows the RTSP port to be changed from the default. BaseStation also allows a targeted RDP over UDP stream to be set up without using RTSP if required. In this case the destination IP Address and port need adding. 7
Clicking on the Install Firmware Option will bring up the following window.
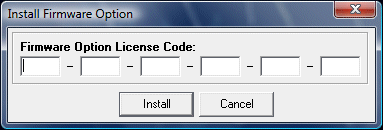
At the moment the only License code in use is for the Radio Scanner Interface and most users will not need this option. For details of the RSI see the Kinetic pages.
Clicking on the Data Source option will bring up two further options to select your data source - Use USB or Use Network (Ethernet).
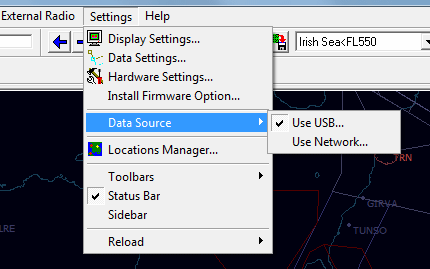
If you change the source a confirmation window will appear to check that you really do want to swap over.
For information on Network setup procedures I suggest users read the Network Setup document at ML&S.
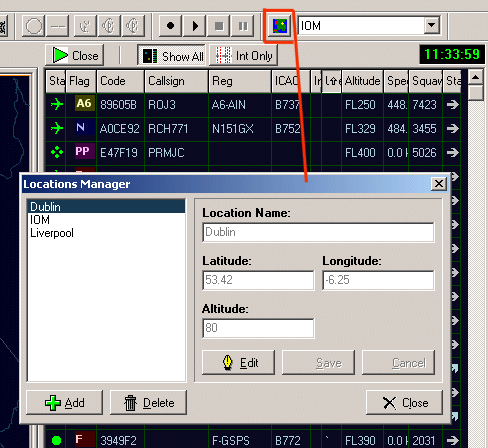
Clicking on the Location Manager option will bring up the Location Manager window. It can also be launched from the toolbar as shown below.
When you first set up BaseStation it will have asked for your Home location. You may not remember this as it only happens the first time you start the program - once you have input a location it is stored in the database. Every time you open BaseStation it always recalls the location you have set - this is normally called Home.
Home location has no relevance to airborne targets - none at all. It is only required for the correct position of ground targets. I'll explain this more..
Position Data
Aircraft send two different types of position data. In the air they send accurate position data which BaseStation decodes correctly. Once an aircraft touches down this activates a squat switch which triggers an IsOnGround signal - and this changes the data being sent by the aircraft. One change is that Altitude is reset to zero (regardless of airfield altitude). The second change is that aircraft start to send very precise position data.
The logic for this change is obvious. Aircraft on the ground need to be seen moving around taxiways and stands - but this level of extreme accuracy isn't essential once in the air.
The problem for SBS users is that the ground position data can't be shown correctly unless BaseStation is adjusted for the ground contact signal format sent.
Limitations of Position
For aircraft in the air the position data being sent is relative to a global grid - it works anywhere in the world.
Aircraft on the ground send such a high resolution signal that it cannot be plotted on a global grid - this is why BaseStation requires your current location - and you do this by adding your location in the Location Manager. With the later releases of BaseStation (from 159) your location does not have to be very accurate as coverage of ground signals is calculated to approx 45 degrees of Latitude/Longitude (about 2700nm). For earlier software versions it was significantly less - only about 90nm - which caused problems for mobile users.
Having said that users who take their SBS on holiday may need to add new locations to the Location Manager. Home location for UK users should be fine for most travel within Europe but if you go further abroad like the USA of Far East you must remember to create a new location for your destination. If you do not you will still see airborne aircraft but may not see aircraft moving around an airport - that's assuming you have signal coverage that overlooks one.
Users who keep their SBS at home will never need any location other than their Home position.
Setting a new Location
To set the new location in Location Manager we need an approximate Lat/Long position. Should you have the airfield plan on screen this becomes a lot easier. Zoom in to the airport you have parked yourself at and move the mouse over the centre of the airport.
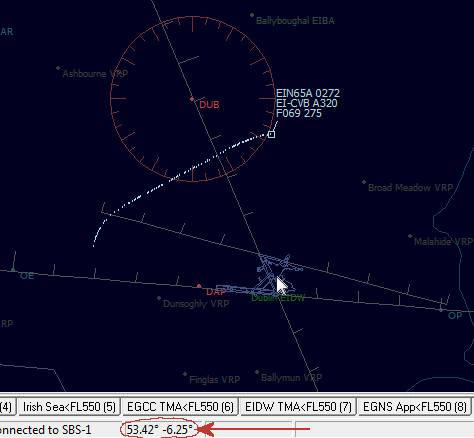
Look on the Status Bar and you will see BaseStation provides you with the Lat and Long values under the cursor. In the above example Dublin is 53.42 North and -6.25 West (note the negative value for West).
Now go to Location Manager (Blue button on the toolbar) and click on Add.
Type in the values for the new airport. Altitude isn't essential so leave this at zero if you haven't got the data. Click on Save and then Close.
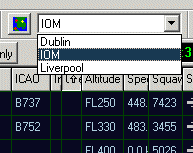
Back on your display you can now select the drop down box and choose the location you are currently located.
Ground traffic should now appear - assuming there is any and you have entered the correct values.
You can add new airports at any time - either on location or prior to going away on holiday..
Warning
If you wish to delete a location take care. Flight records are linked to the location used for each session. Deleting a Location will also result in the associated Flight Records being removed. In addition all previous Flight records in previous sessions for that location will be lost too so it has a long term impact.
Essentially no location should be deleted if it has been used in any session for which Flight records still exist. If the data has already been deleted (if you have very low purge values set for Flight records) then the location could be removed.
The deletion of the flight records has no impact on any aircraft records - these remain untouched.
Screen Views
BaseStation allows you to create additional radar screen views so you can build up a number of preset locations, each with specific settings. I have a number of these set up for both general area viewing and for more detailed views of Manchester and Dublin TMA's. Some of these views are height filtered and others are not.
In addition BaseStation allows users to create additional radar screen tabs (see below). This allows you to allocate your more useful saved views to tabs for quick switching between views.
There is one important point about radar screen views that needs to be remembered and that is each view retains the radar screen settings in force at the time the view was saved. This means you can set your screen to an area you want and save the view with maybe waypoints on and no height filters. You could then turn waypoints off, apply a height filter and save this as a different saved view.
When you create a new screen view the values for this are stored in the basestation.ini file. For my EGCC TMA<FL550 tab above the line in the INI file is as follows:
[SavedViews]
EGCC TMA<FL550=64,53.3606691919192,-2.51430949153405,0,0,55000,0,-1,-1,0,-1,0,0,0,0
This slightly complex line records all the parameters that are saved when creating the view. These parameters are:
|
EGCC
TMA<FL550
|
The name of the view you saved |
|
64
|
Range (or Zoom Level) |
|
53.3606691919192
|
Screen Centre Latitude |
|
-2.51430949153405
|
Screen Centre Longitude |
|
0
|
Altitude |
|
0
|
Bearing |
|
55000
|
Upper Height Limit |
|
0
|
Lower Height Limit |
|
-1
|
Display Trails |
|
-1
|
Display Waypoints |
|
0
|
Display Range Rings |
|
-1
|
Display Outlines |
|
0
|
Display Bearing and Distance |
|
0
|
Display Interested only |
|
0
|
Show Centre and Bearing Tracking |
|
0
|
Display Selected only? (Guess) |
You can see that a saved view doesn't just record the screen position and zoom level. It remembers if you have tilted the screen from North, any height band filters set and whether options like Waypoints, Outlines and Range Rings are turned on or off. In my example above you can see that I have Trails, Waypoints and Outlines selected on (-1) but all others options are off (0).
When you create a new view I would suggest that you first go through the various buttons (for outlines and such) and set these as appropriate for the view you want. Note that the View Centre and Bearing and the Height Limits are set separately in the Radar Menu. Once the screen is set up exactly as you would like save the view and all the values will be remembered.
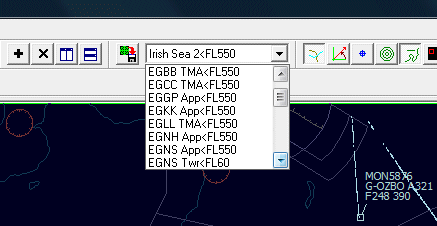
Saved views are added to the drop down box shown above. To switch views you simply click on the view you want.
Tabs
Most users have a favourite view which may be on display most of the time. Switching to another view can be messy in that you have to go through the drop down menu twice before jumping back to your default view.
BaseStation has the option to create tabs that sit at the bottom of the display and give you one click access to other saved views. This makes it easier as you can set up several tabs for your more useful views and you only have to click on each to flick between them.
To set up a new tab you click on the + button on the menu bar. The new tab will appear and by default it will show the saved view which is at the top of the drop down list. To allocate the tab to a different view all you need do is click the tab so it has focus and the go to the drop down list and choose the view you want for the tab.
To add a second (or third or tenth) tab to your display just click on the + sign in the toolbar again and repeat the process.
As you can see from the shot above I have eight tabs set up on my display. I have about 25 saved screen views but only look at some rarely so it is not worth setting up a tab for every one.
Many users create a lot of saved views when they first play with this facility and subsequently find that not all are needed. Whilst you can remove a radar tab from your display by clicking on the X button all this does is remove the tab - not the saved view. The saved views still appear in your drop down list and if you find these annoying and wish to remove them the bad news is that you can only do this by editing the basestation.ini file.